Projects overview dashboard
The Analytics > Overview page is a centralized starting point to explore performance insights across multiple projects.
Access by user role
| User role | Access restrictions |
|---|---|
| Owner and Admin | Can view the Overview dashboard and filter for all workspaces and projects. |
| Manager | Can view the Overview dashboard, but can only filter for and view workspaces or projects in which they are a member. |
| Reviewer and Annotator | Cannot access the Overview dashboard. When they open Analytics, they are redirected to the Member Performance dashboard, where they can only see their own annotation and review history. |
Filtering
Filter by project and workspace
Select one or more workspaces or individual projects. To see all projects, select All Workspaces at the top of the workspace filter.
This does not include Personal Sandbox projects, and is limited to 50 projects at a time.
Filter by date range
You can select a date range to apply to the project metrics. If you want to be precise, you can also include time.
Note that annotation and acceptance metrics are calculated on when they are completed, not when they begin.
For example, say you select a date range of 2 days: Monday and Tuesday. If an annotator opens an annotation on Tuesday, begins working on it, and then submits it on Wednesday, then that annotation and the time they spent on it will not be included in the metrics.
Tasks and project states
For more information about the states referenced in the Overview dashboard, see Project and task state management.
note
Project and task state history tracking did not start until state management was implemented for your organization. For most Label Studio Cloud organizations, state management was implemented in February 2026.
This means that the Overview dashboard will not reflect when a project or task changed states if that change happened before state management was implemented.
Project progress summaries
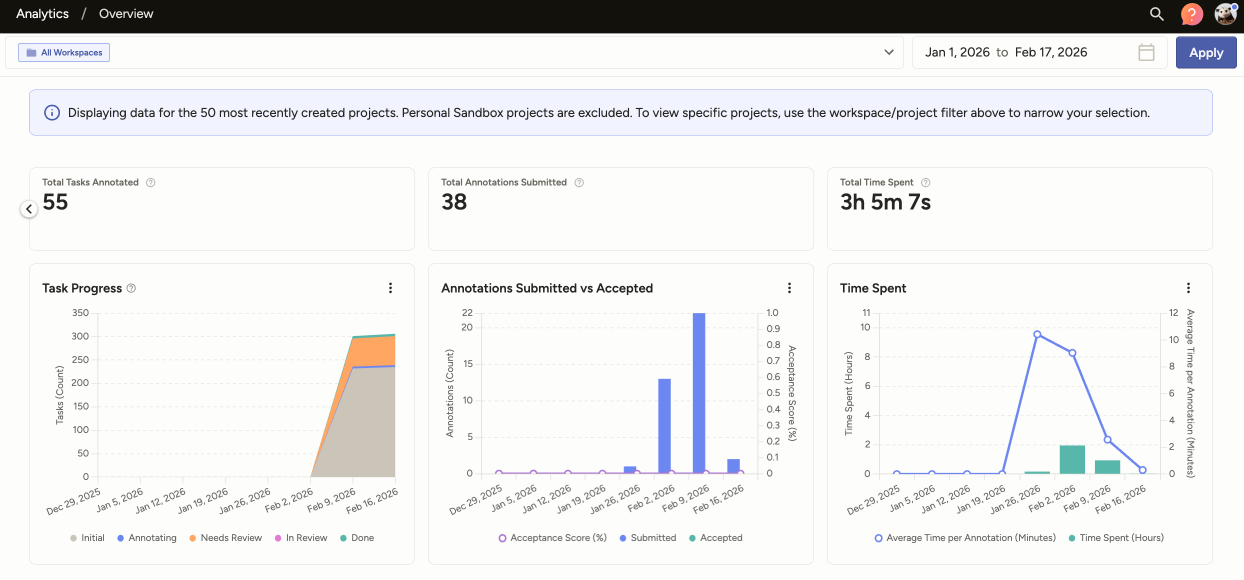
At the top of the Overview dashboard, summary cards show aggregate metrics for the selected date range and workspaces or projects.
note
A dash (--) appears when there is no data. A zero (0) appears when there is data available and the value is zero.
| Metric | Description |
|---|---|
| Total Done Tasks | Total number of tasks in the Done state across the selected projects. |
| Total Tasks Annotated | Total number of tasks that have the required annotations completed across all selected projects. This includes tasks in the Done state, Needs Review state, and the In Review state. |
| Total Annotations Submitted | Total number of annotations submitted across all selected projects. This includes annotations that have been submitted or updated, whether or not they have been reviewed. |
| Total Time Spent | Total time spent annotating (lead time) and reviewing across all selected projects. The lead time is the time spent on annotations in which the last action was one of the following: Submit, Update, Fix + Accept, Accept, Reject. Lead time includes idle time and is cumulative across multiple sessions. |
Project progress charts
The Overview dashboard includes charts that break down metrics over the selected time period.
Dates for annotations and reviews are based on when they were completed, not when they were started.
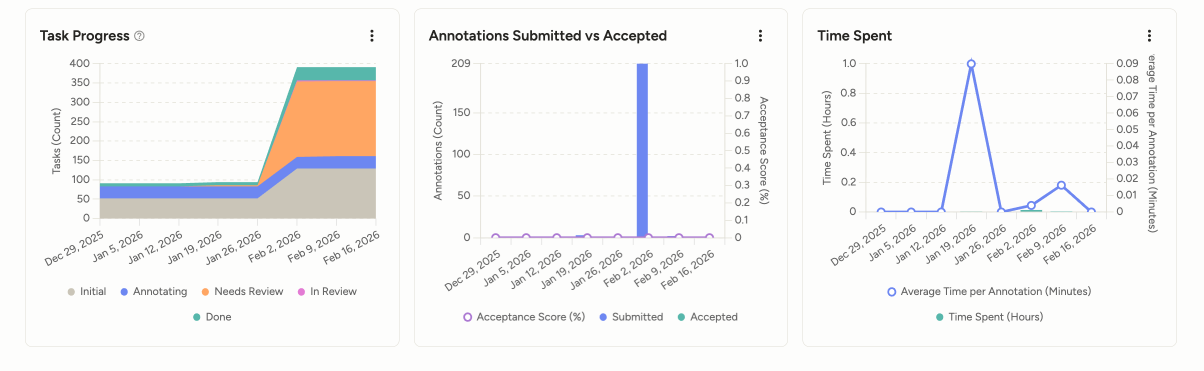
| Chart | Description |
|---|---|
| Task Progress | Shows how tasks move through states over the selected period of time. |
| Annotations Submitted vs Accepted | Shows submitted annotations and accepted annotations over time, with an acceptance score line (the acceptance score is the number of accepted annotations divided by the number of annotations reviewed). Note that accepted annotations includes annotations that were fixed and then accepted. |
| Time Spent | Shows time spent annotating and reviewing over time. Includes total time in the period and average time per submitted annotation. |
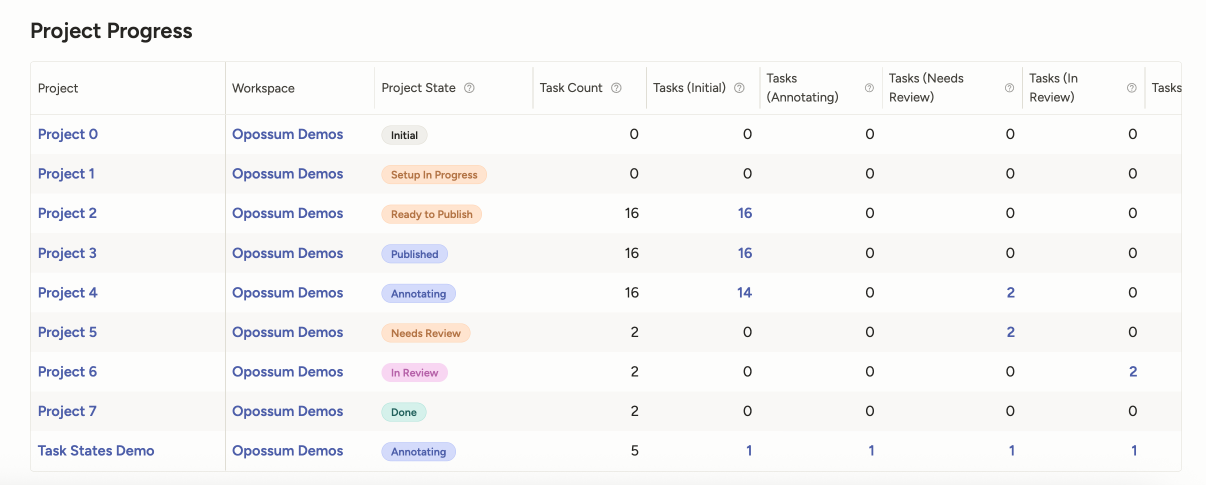
Project progress table
The Project Progress table display detailed metrics for each project.
note
A dash (--) appears when there is no data. A zero (0) appears when there is data available and the value is zero.
| Column | Description |
|---|---|
| Workspace | The workspace that contains the project. |
| Project | The project name. Click to open the project dashboard. |
| Task Count | Number of tasks in the project. This includes every task and is not date filtered. |
| Tasks (Initial) | Number of tasks in the Initial state. |
| Tasks (Annotating) | Number of tasks in the Annotating state. |
| Tasks (Needs Review) | Number of tasks in the Needs Review state. |
| Tasks (In Review) | Number of tasks in the In Review state. |
| Tasks (Done) | Number of tasks in the Done state. |
| Tasks Annotated | Total number of tasks that have each received the required number of annotations during the selected date range. This includes tasks in the Done state, Needs Review state, and the In Review state. |
| Annotations Submitted | Number of annotations submitted (includes those updated and/or reviewed). |
| Annotations Accepted | Annotations accepted or fixed and then accepted. |
| Total Time Spent | Total time spent annotating and reviewing annotations. |
| Avg Time / Annotation | Average time spent per submitted annotation. Includes both annotation and review times. |
| Avg Agreement Score | Average agreement Score across all tasks which have received the required number of annotations. |
| Acceptance Score | Total number of accepted annotations divided by the number of annotations that have been reviewed. |